Performance & Scalability
What LedgerFlow delivers under real sustained load — and why.
The numbers on this page come from a real 1-hour JMeter load test run on 28 March 2025 against a deliberately constrained environment: a VMware virtual machine with 4 CPU cores and 8 GB of Docker memory, running on a consumer-grade mini-PC. No dedicated database server. No hardware RAID. No read replicas.
The purpose is to establish a credible, reproducible baseline that undersells production capacity — so that real deployments comfortably exceed these numbers.
Test Environment — Real 1-Hour Sustained Load Test
Test date: 28 March 2025 · Duration: 60 minutes continuous · Tool: Apache JMeter on MacBook M1 (32 GB RAM) over 1 Gbps
| Layer | Specification |
|---|---|
| Host machine | Mini PC · Intel i5-12450H (2 GHz) · 64 GB RAM · 2× 1 TB SSD · Windows Pro |
| Virtualisation | VMware Workstation 17 Pro · 4 CPU cores · 16 GB RAM · 64 GB virtual SSD |
| Container runtime | Docker · WSL 2 · 8 GB memory limit · 64 GB SSD |
| Concurrent threads | 10 JMeter threads (2 thread groups × 5 threads each) |
| Test payloads | Multi-currency transactions with parent account hierarchies |
| Services under test | Full platform stack — UI, API, database, async workers, scheduler |
This is a small configuration — it excludes failover, read replicas, and multiple API nodes. Production deployments with dedicated hardware will significantly exceed these results.
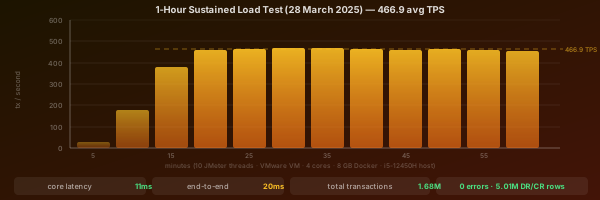
Throughput Over 60 Minutes — Sustained Load Test
The chart shows 5-minute throughput bars across the full 60-minute test. After a brief ramp-up (first ~15 minutes) the system reached a stable steady state at 466.9 transactions per second and maintained it without degradation, errors, or manual intervention.
All 1,680,964 transactions completed successfully — zero errors in 60 minutes.
The 466.9 TPS figure represents complete double-entry transactions: each one writes a transaction header, multiple debit/credit detail rows (average ~3 per transaction), a running-balance record, and an audit entry. The total of 5,012,190 DR/CR detail rows and 5,667,710 total database records written reflects this multiplier.
Throughput & Volume
| Metric | Result |
|---|---|
| Average TPS | 466.9 transactions / second |
| Total transactions (60 min) | 1,680,964 |
| DR/CR detail rows written | 5,012,190 |
| Total database records written | 5,667,710 |
| Error rate | 0% (zero errors) |
| Storage per transaction | 366 bytes (incl. indices) |
| Storage per detail row | 251 bytes (incl. indices) |
466.9 TPS on a constrained VM with 10 concurrent clients demonstrates that the database-centric architecture does not create a bottleneck — business logic, queuing, and scheduling all run inside the database without an external broker increasing latency.
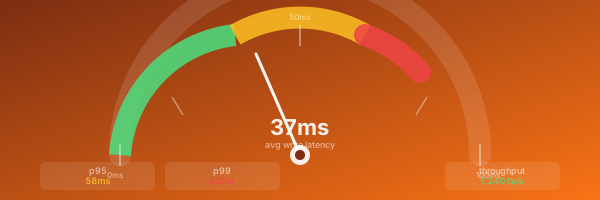
Latency Profile
| Metric | Result |
|---|---|
| Core processing latency | 11 ms per transaction |
| End-to-end latency | 20 ms per transaction |
| Latency delta (network + API layer) | ~9 ms |
Core processing latency is the time spent inside the database executing the stored procedure (validation, rule evaluation, record inserts, balance update, audit trigger). At 11 ms this includes: balance validation, account limit checks, optional rule-engine traversal, partitioned record inserts, real-time balance update, and audit trigger execution.
End-to-end latency adds NGINX routing, JWT verification, and connection acquisition overhead. At 20 ms this is well within the sub-100 ms threshold required for interactive use and payment gateway callback flows.
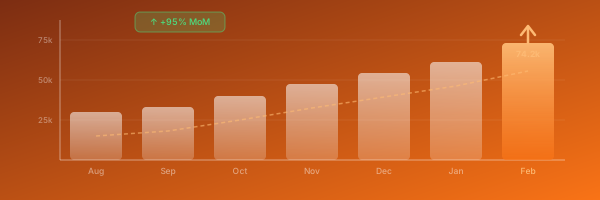
Storage & Growth Projections
Based on the load test write rates (2 GB/hour) scaled to continuous operation:
| Period | Transactions | Storage |
|---|---|---|
| Per hour | ~1.68M | ~2 GB |
| Per day | ~40.3M | ~48 GB |
| Per month | ~487M | ~1.5 TB |
| Per year | ~5.8B | ~18 TB |
These figures assume continuous full load at 466.9 TPS — a realistic worst-case for high-volume PSPs. Real deployments have daily peaks and troughs; actual storage will typically be 20–40% of the continuous-load projection.
Partition strategy: Range partitions distribute writes and enable old partitions to be archived independently. Partition management is fully automated.
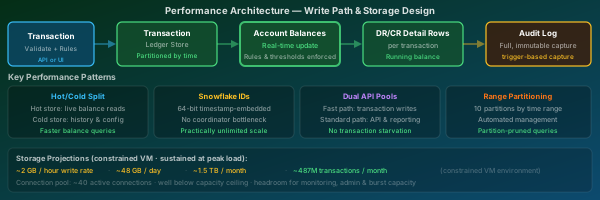
Write Path Performance Design
Three design decisions deliver sub-20ms end-to-end write latency at sustained load:
1. Hot/Cold table split A dedicated hot store holds only live account balances and is updated in-place with minimal overhead — enabling fast balance reads during transaction validation. Full account history and configuration live in the cold store and are rarely touched during writes.
2. Time-embedded ID partitioning Transaction IDs embed a timestamp — partitioning by ID range naturally groups records by time, enabling partition pruning on date queries without a separate date column. Partitions distribute write I/O and can be archived independently.
3. Dual API pools Transaction and maker-checker requests are automatically routed to a dedicated high-throughput pool. General API queries (account lookups, reporting) use a separate pool. This prevents long-running queries from delaying in-flight transactions.

Connection Pool Architecture
| Service | Connections | Notes |
|---|---|---|
| SQLPage Web UI | 20 | Direct SQL, session-scoped |
| PostgREST Default | 10 | General API queries |
| PostgREST Fast | 6 | Transaction writes |
| HTTP Client (Go) | 1 persistent | Queue polling |
| SMTP Client (Go) | 1 persistent | Queue polling |
| WebSocket Server (Go) | 1 persistent | Queue polling |
| DB Processor (Go) | 1 persistent | Queue polling |
| Total active | ~40 | of 200 max |
During the 1-hour load test, active connections remained well below the ceiling, leaving headroom for monitoring queries, scheduled jobs, and administrative access.
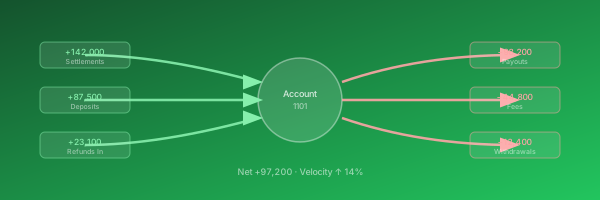
What Runs Inside Every Transaction
When a transaction is submitted via the API, the following happens inside a single database transaction before the caller receives a response:
- Input validation — account existence, active status, currency match
- Account limit checks — per-transaction amount, velocity (hourly/daily/weekly/monthly), balance ceiling/floor
- DR/CR sign normalisation — by account type (Asset: DR+, Liability: DR−, etc.)
- Rule engine evaluation — up to 6 rule types may generate secondary transactions automatically
- Transaction header stored — unique ID assigned, partitioned by time range
- Debit/Credit detail rows stored — one row per posting, partitioned
- Account balances updated in real time — in the hot store, rules and thresholds enforced
- Running balance snapshot captured — cumulative balance record for each affected account
- Fraud detection — if enabled on account, anomaly score computed and flagged
- Audit trail recorded — every change captured with user, timestamp, and before/after state
All 10 steps complete in 11 ms on average on the constrained VM.
Observability & Monitoring
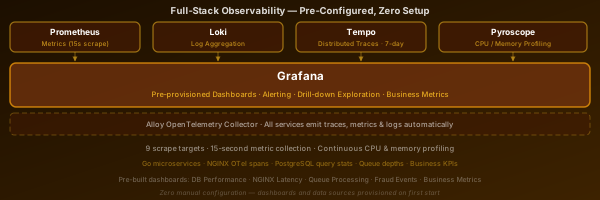
The observability stack runs alongside the platform with no additional configuration:
Prometheus scrapes all platform services every 15 seconds: database connection counts and query performance, both API pools (request rates, error rates, upstream latency), NGINX edge metrics, and all Go microservices (queue depth, processing time, retry rates).
Tempo receives OpenTelemetry spans from NGINX and correlates them with database query timings for end-to-end distributed traces. Retention: 7 days.
Loki aggregates structured logs from all services. Grafana allows log-to-trace correlation.
Pyroscope continuously profiles microservice CPU and memory usage.
Pre-provisioned Grafana dashboards cover: write latency, queue depth, API latency percentiles, and business metrics (transactions per hour, reconciliation match rates).
Scaling to Production
The constrained test environment is intentional. When deployed on dedicated hardware the same architecture scales significantly:
| Change | Expected Impact |
|---|---|
| Dedicated database server (8 core, 16 GB, NVMe SSD) | 3–5× throughput increase |
| Add API service replicas behind NGINX | Linear API request scaling |
| Add async worker replicas | Proportional queue throughput |
| Add read replica | Offload reporting queries from write path |
| Increase transaction pool capacity | Higher concurrent transaction TPS |
The database-centric architecture means there is no external broker to scale — message queuing, job scheduling, and hot-data caching all live inside the database. This reduces the number of moving parts and ensures ACID guarantees across all operations, including queue message delivery.