Observability — full-stack visibility, built in
Every request in LedgerFlow is traceable end to end — no extra setup, no external SaaS.
The platform ships with a complete OpenTelemetry + LGTM observability layer (traces, metrics, logs, continuous profiling) that starts together with the application and is surfaced through a single Grafana pane. Operators see exactly where time goes for any call; integrators can measure their own API requests against the real system.
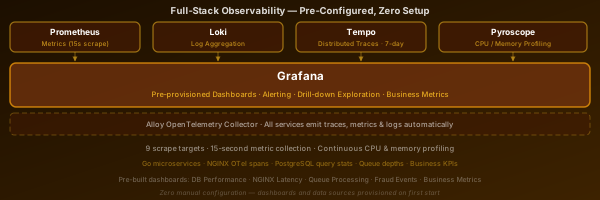
Four signals, one pane of glass
A modern, collector-centric stack: every component emits standard telemetry to one collector, which fans it out to purpose-built backends, all viewed in Grafana.
- Traces — a single request is followed across the whole path (edge → REST API → PostgreSQL,
plus the AI/MCP and async-worker paths). The W3C
traceparentheader is propagated end to end. - Metrics — every service is scraped on a fixed interval: database pool/health, both API pools (request + error rate, latency), edge metrics, and all microservices (queue depth, processing time, retries). RED (Rate/Errors/Duration) metrics are derived from the traces themselves.
- Logs — structured logs from all services, aggregated centrally and stamped with trace ids.
- Continuous profiling — CPU, memory/allocations and goroutines for the services, so a regression can be traced to the exact function.
One click between signals
The value is the correlation — all from one place:
- trace → logs — every log line for a span,
- trace → metrics — the service's RED dashboard,
- trace → profile — the flame graph for a span,
- metric → trace — click a latency spike and land on a representative trace,
- log → trace — follow a log line back to the full request.
So "why was this transaction slow?" moves from a dashboard, to the offending trace, to its logs, to the CPU profile of the responsible function — without correlating timestamps by hand.
What's instrumented
- Edge proxy — creates the root span per request and propagates trace context; exposes connection/throughput metrics.
- REST API — pool / schema-cache / JWT-cache metrics; echoes the
traceparentheader for trace continuity; adds aServer-Timingresponse header (auth/parse/plan/transaction/response phases). - SQL-driven UI — a span tree per page render, correlated with database timing.
- Database — pool, replication and statement-level metrics, plus slow-query plans.
- Microservices — async workers and the AI/MCP services are fully traced, metered and profiled, with trace↔profile correlation.
Business-level visibility
The same stack surfaces business metrics — transaction throughput, queue depth, reconciliation match rates, API latency percentiles — on pre-provisioned dashboards. Because queuing, scheduling and hot-data caching all live inside PostgreSQL, operational and business signals come from one consistent source instead of a sprawl of external brokers.
Self-hosted, configurable, yours
- Zero-config to start — comes up alongside the platform.
- Self-hosted — all telemetry stays inside your deployment; nothing ships to a third party.
- Tunable — how long each signal is retained, and where its data lives, are configuration values: small on a laptop, generous in production.
- Standards-based — OpenTelemetry + Prometheus throughout, so the data is portable to your own central observability platform if you run one.
Measure your own integration
Because the platform is fully traced, you can measure your own calls rather than guess. Send
a request, read the echoed traceparent and the Server-Timing response header to see the
server-side phase breakdown, and — with operator access — open the matching end-to-end trace to see
exactly how the call was handled. Latency has a source you can point to, and production issues are
diagnosable from first principles, not from logs alone.