Proprietary Cyclic Anomaly Detection
Eight-dimension behavioural profiling — entirely inside PostgreSQL.
Most fraud detection systems apply static rules: block transactions over a fixed amount, flag logins from new countries, reject velocity above a threshold. These rules are easy to tune around and generate noise as business patterns evolve.
LedgerFlow's fraud engine takes a different approach: it learns each account's normal behaviour from 90 days of history, models that behaviour using circular statistics that correctly handle the midnight wraparound problem, and surfaces only genuine deviations. No rules to maintain. No machine learning infrastructure to deploy. No external service to depend on. The entire engine runs inside the same PostgreSQL database that books your transactions.
Why Circular Statistics? The Midnight Problem.
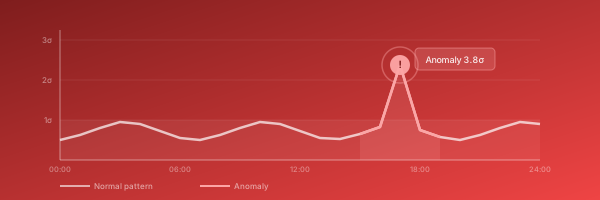
Time-of-day is a circular variable. 23:50 and 00:10 are 20 minutes apart — but if you represent time as a plain number (2390 vs. 10), a linear mean places their midpoint at noon. Standard deviation calculations collapse. A customer who always transacts at midnight looks statistically anomalous at both 23:59 and 00:01.
LedgerFlow's solution: Convert each transaction's hour to an angle on the unit circle
(sin(hour × 15°), cos(hour × 15°)), accumulate the vector sums, and compute the mean
angle using atan2d(sin_sum, cos_sum). The resulting mean is always topologically correct.
Deviation is measured as circular variance — the spread of angles around that mean, not
the variance of flat numbers.
This is the same statistical technique used in chronobiology, meteorology, and navigation. LedgerFlow applies it to per-account transaction timing at scale.
Practical result: A merchant who settles every day at midnight has a tight circular cluster near 00:00. A transaction at 14:00 is a genuine 14-hour deviation — correctly flagged. A transaction at 00:10 is barely off-baseline — correctly ignored. No rules to write. No thresholds to maintain. The baseline updates itself from history.
Eight Anomaly Dimensions → One Composite Score
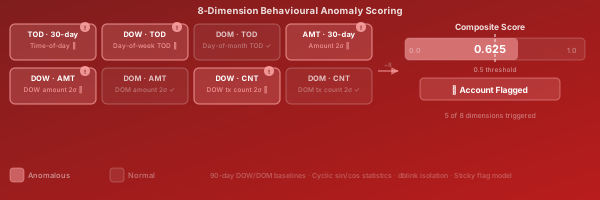
Every transaction is scored across 8 independent dimensions the moment it is posted
to the ledger. Each dimension produces a binary flag (0 = normal, 1 = anomalous). The
composite score is the unweighted mean of all 8 flags: sum(flags) / 8 ∈ [0.0, 1.0].
The diagram shows an example account with 5 of 8 dimensions triggered — a composite score of 0.625, which exceeds the default threshold of 0.5 (≥ 4/8 flags). The account is automatically flagged and the operator dashboard surfaces it for review.
Threshold is configurable per account profile. High-volume merchant accounts may warrant a higher threshold (0.75) to reduce noise; retail accounts under enhanced monitoring may use a lower threshold (0.375). Thresholds are inherited from the account profile template.
Time-of-Day Profiling — 30-Day Baseline
The simplest and most effective single dimension: does this transaction happen at an unusual time of day for this account?
How it is built:
- Every transaction's hour-of-day is accumulated into the 30-day profile table
(
api.last_thirty_days_per_account) - Circular mean and circular variance are computed from the accumulated sin/cos vectors
- At scoring time: the new transaction's hour angle is compared against the mean ± 1σ envelope
When it fires:
- The new transaction's circular distance from the baseline mean exceeds 1 standard deviation
- Minimum 10 prior transactions required before this flag is active (cold-start protection)
The 30-day window refreshes continuously via a pg_timetable nightly batch job that drops transactions older than 30 days and recomputes the summary statistics.
DOW and DOM Profiling — 90-Day Baselines
Beyond raw time-of-day, normal behaviour varies by day of week (DOW) and day of month (DOM). A business that processes payroll on the last Friday of the month will look anomalous on any other Friday — but that is normal, not fraud.
Two separate 90-day profile tables:
api.last_ninety_days_per_account_dow— separate time-of-day baseline per DOW (Monday through Sunday)api.last_ninety_days_per_account_dom— separate time-of-day baseline per DOM (1st through 31st)
Each cell in these tables holds the circular statistics for that specific DOW or DOM slice. Scoring compares the new transaction against the baseline for its own DOW/DOM — so Monday morning activity is never compared against Saturday evening patterns.
The 90-day window provides enough history for monthly and seasonal patterns to stabilise, while remaining recent enough to track legitimate business evolution.
Amount Anomaly Detection — 2σ Threshold
Is this transaction amount statistically unusual for this account?
Amount anomaly uses standard (non-circular) statistics because currency amounts are not circular. The 30-day and 90-day DOW/DOM profiles each accumulate a running count, sum, and sum-of-squares for transaction amounts — enabling online standard deviation computation without storing every individual transaction.
Flag fires when:
abs(new_amount - mean_amount) > 2 × stddev_amount
The 2σ threshold means approximately 5% of transactions would be flagged by chance alone if amounts were perfectly normally distributed. In practice, financial transaction amounts are highly skewed (many small, few large), making genuine outliers far more distinct.
Cold-start guard: Minimum 10 transactions required before amount flags activate. Newly opened accounts with few transactions are not penalised for unusual single amounts.
Velocity Anomaly Detection — Daily Count
Is this account processing an unusual number of transactions today?
Velocity anomaly tracks the daily transaction count per DOW and DOM. A merchant that normally processes 200 transactions on Mondays raising 2,000 transactions on a Monday is flagged — even if every individual transaction is normal in isolation.
Flag fires when:
abs(today_count - mean_daily_count_for_this_dow) > 2 × stddev_daily_count_for_this_dow
Separate DOM velocity tracks monthly-pattern businesses (e.g., subscription billing that runs on the 1st of each month generates a volume spike that should not flag on the 1st but would be unusual mid-month).
Why this matters: Many fraud patterns — card testing, account enumeration, automated payment farming — are invisible at the individual transaction level but produce dramatic velocity anomalies at the account level. This dimension catches what per-transaction checks miss.
Composite Score, dblink Isolation, and the Sticky Flag Model
Composite score: score = sum(8 binary flags) / 8 ∈ [0.0, 1.0]
A score of 0.5 means exactly 4 of 8 dimensions are anomalous. The default threshold is 0.5 — an account scoring ≥ 0.5 is flagged. Operators can tune the threshold per account profile without changing code.
dblink isolation — why it matters:
Anomaly flags are written to api.transactions_details_anomalies using a dblink
connection to the same database in a separate transaction. This is a deliberate design
choice: if the outer transaction that posted the original transaction is later rolled back
(for example, due to a constraint violation), the fraud flag persists.
Without this isolation, a crafted sequence of attempts — post a flagging transaction,
then cause a rollback — could clear the flag. With dblink, the flag cannot be
erased by transaction mechanics.
Sticky flag model:
Once an account is flagged, it skips re-scoring on subsequent transactions. The flag remains set until an operator explicitly clears it from the Fraud Center dashboard. This prevents score dilution — a flagged account cannot "wash out" the flag by processing many normal-scoring transactions before an operator reviews it.
Clearing a flag is a full audit event recorded in security.system_audit.